Choose simulation practice by the error you need to fix. If you can write a loop but cannot explain what experiment it represents, start with a small probability model. If the model is clear and the syntax is blocking you, use a programming lesson. Advanced Monte Carlo methods solve a different preparation problem.
The existing Probability & Trading Interview Workbook includes a simulation chapter linking an analytic target, Python implementation, sampling variation and changed assumptions. It is introductory probability practice, not a derivatives-pricing library or a comprehensive numerical-methods course. Purchases remain closed; the actual free PDF sample shows the opening lessons, not the later simulation chapter.
Try a model diagnostic first
Original exercise: draw two independent fair integers from one through four, with replacement. Estimate the probability they match. The exact target is four matching ordered pairs out of sixteen, or 1/4.
A program that draws one integer and copies it into both positions will report a match every time. A program that samples two distinct values without replacement will report no matches. Neither problem is solved by running another million trials.
Before using a practice product, explain those three outcomes aloud. You should be able to identify the random draws, replacement rule and event without pointing to the code.
Match the preparation to your difficulty
| Your current gap | Start here |
|---|---|
| You confuse the event with the output variable | Write a one-trial experiment on paper |
| You cannot build the finite sample space | Enumerate a small case before simulating |
| You understand the model but not the implementation | Use language and random-generator documentation |
| You want connected probability and simulation practice | Inspect the existing workbook's scope and public sample |
| You need stochastic differential equations or advanced variance reduction | Seek specialist material; those are not this workbook's promise |
The free simulation-model check develops the exercise into a review sheet. Use it before committing to a longer preparation sequence.
What a useful solution should reveal
A worked solution should state its assumptions, give an independent comparison where available, and explain a discrepancy. A decimal alone hides the most useful part of the work. Fixed seeds help reproduce a particular computation; they do not establish that the intended probability model was implemented.
Carnegie Mellon's simulation lecture provides free instruction on sampling and reproducibility. NumPy's generator documentation explains its random-generator interface and compatibility limits. Neither resource is a prediction of an employer's questions.
Make the purchase decision from an actual attempt
Record your failed step in a probability error log. If one free explanation resolves it, continue practicing with your own variations. Consider the workbook when you want simulation connected to counting, conditioning, expectation and decision exercises with explained solutions. Compare the real contents and sample rather than a claim that a particular number of questions guarantees readiness.
Read before choosing
Open the actual pages.
11 sample pages, including complete explanations. No email address or account required.
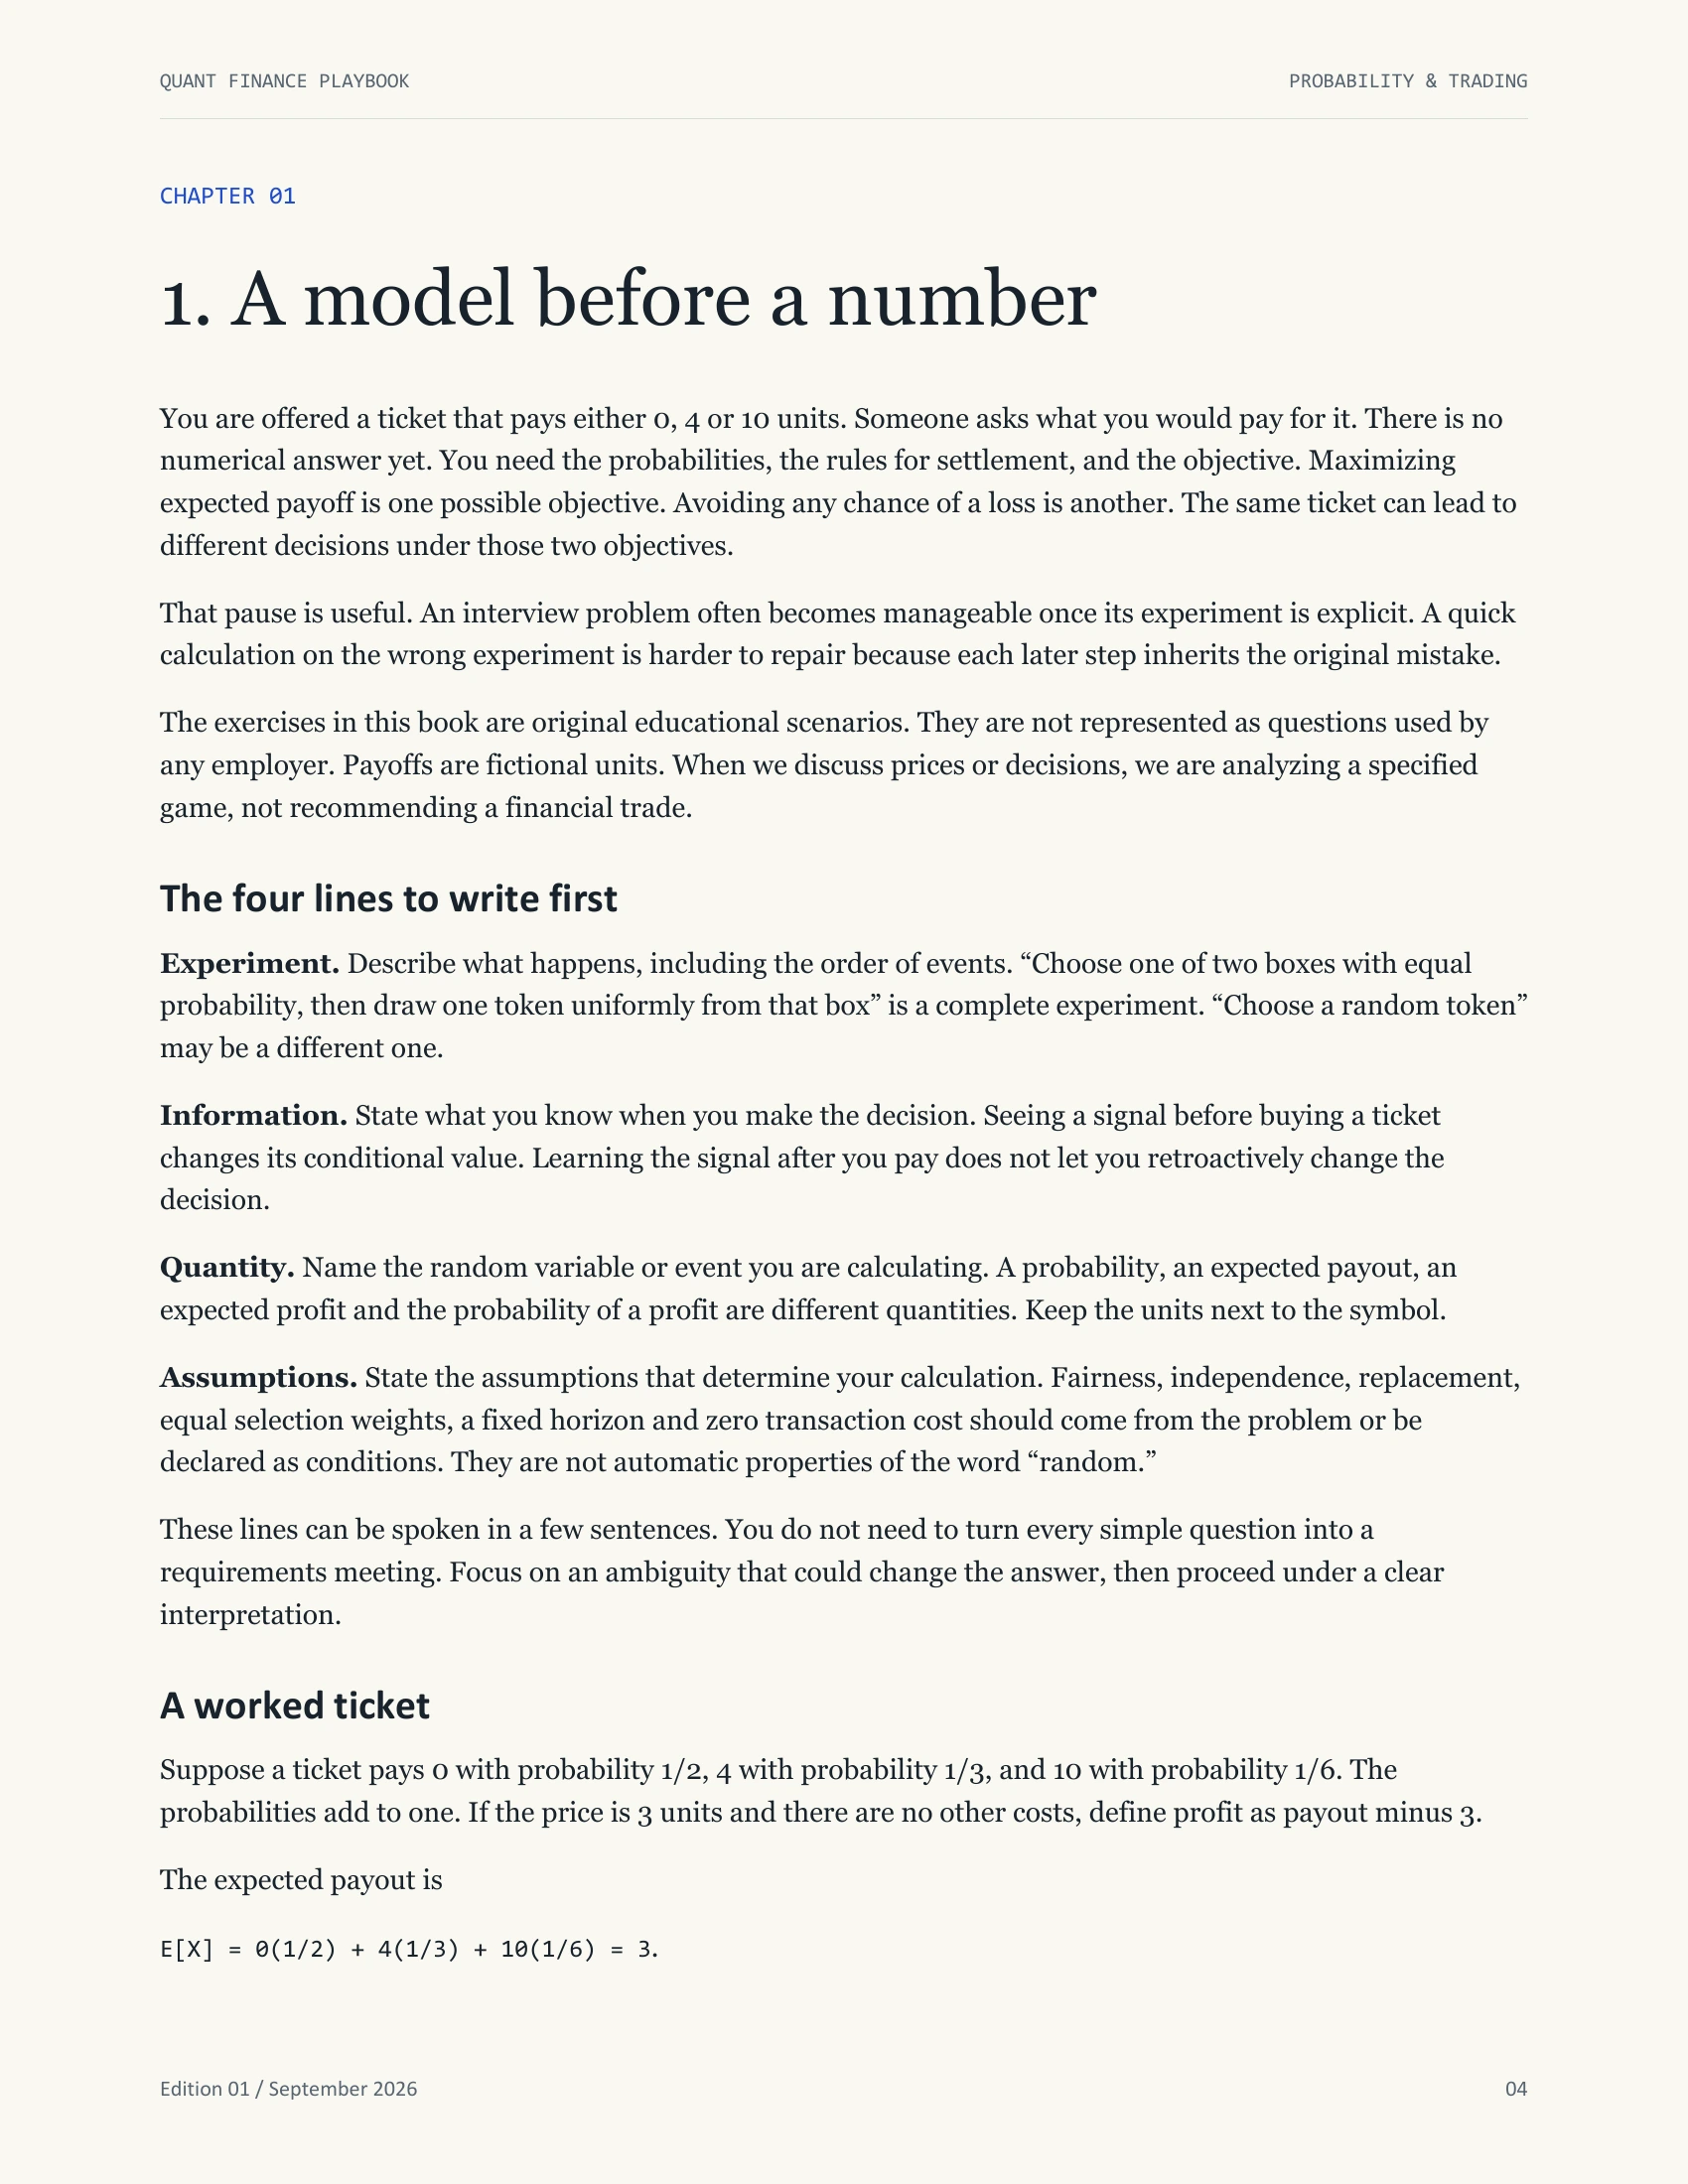
Open the PDF previewPreview page 4 of 11. Use Enlarge page for a closer view. When the page is focused, use left and right arrows to change pages.
Read the complete free sample as text (11 pages)
Text from the same public sample shown above. Use the page images or PDF for diagrams, equations and original layout.
Sample page 1
QUANT FINANCE PLAYBOOK REASONING / PROBABILITY / DECISIONS Probability & Trading Interview Workbook Build the model. Explain the calculation. Adapt when the assumptions change. H / 0.20 L / 0.80 P(H | +) EDITION 01 / ORIGINAL PRACTICE & WORKED EXAMPLES
Sample page 2
QUANT FINANCE PLAYBOOK PROBABILITY & TRADING Edition 01 / September 2026 02 HOW TO USE THIS BOOK Probability & Trading Interview Workbook Twelve chapters, forty original exercises with solutions, and two extended mock sessions. Requires basic algebra; introduces the continuous probability used in the exercises. Read the model before reading the answer. Try each exercise on paper, keep your first attempt, and use the explanation to diagnose the first step that needs repair. Original educational examples The exercises and candidate scenarios are original teaching material. They are not leaked employer questions, employment outcomes, or descriptions of actual trading performance. Sources identify public guidance and further reading; cited organizations do not endorse this publication. Edition 01 September 2026. Independent educational material. This edition has not been reviewed by an identified industry practitioner. Use the supplied companion files alongside the chapters, and distinguish fictional examples and synthetic results from your own evidence. CONDITION ON THE OBSERVATION H 150 / 200 positive L 80 / 800 positive Blue: positive signals. Among 230 positives, 150 are H. Posterior = 15/23.
Sample page 3
QUANT FINANCE PLAYBOOK PROBABILITY & TRADING Edition 01 / September 2026 03 CONTENTS Your route through the work 4 1. A model before a number 8 2. Conditioning changes the room 12 3. Counting without losing the experiment 15 4. Expectation without enumeration 18 5. Risk and dependence 21 6. Waiting and stopping 24 7. Continuous reasoning 26 8. Estimation and uncertainty 29 9. Toy markets and information 32 10. Simulate to investigate 35 11. Two original mock sessions 38 12. Repair your practice
Sample page 4
QUANT FINANCE PLAYBOOK PROBABILITY & TRADING Edition 01 / September 2026 04 CHAPTER 01 1. A model before a number You are offered a ticket that pays either 0, 4 or 10 units. Someone asks what you would pay for it. There is no numerical answer yet. You need the probabilities, the rules for settlement, and the objective. Maximizing expected payoff is one possible objective. Avoiding any chance of a loss is another. The same ticket can lead to different decisions under those two objectives. That pause is useful. An interview problem often becomes manageable once its experiment is explicit. A quick calculation on the wrong experiment is harder to repair because each later step inherits the original mistake. The exercises in this book are original educational scenarios. They are not represented as questions used by any employer. Payoffs are fictional units. When we discuss prices or decisions, we are analyzing a specified game, not recommending a financial trade. The four lines to write first Experiment. Describe what happens, including the order of events. “Choose one of two boxes with equal probability, then draw one token uniformly from that box” is a complete experiment. “Choose a random token” may be a different one. Information. State what you know when you make the decision. Seeing a signal before buying a ticket changes its conditional value. Learning the signal after you pay does not let you retroactively change the decision. Quantity. Name the random variable or event you are calculating. A probability, an expected payout, an expected profit and the probability of a profit are different quantities. Keep the units next to the symbol. Assumptions. State the assumptions that determine your calculation. Fairness, independence, replacement, equal selection weights, a fixed horizon and zero transaction cost should come from the problem or be declared as conditions. They are not automatic properties of the word “random.” These lines can be spoken in a few sentences. You do not need to turn every simple question into a requirements meeting. Focus on an ambiguity that could change the answer, then proceed under a clear interpretation. A worked ticket Suppose a ticket pays 0 with probability 1/2, 4 with probability 1/3, and 10 with probability 1/6. The probabilities add to one. If the price is 3 units and there are no other costs, define profit as payout minus 3. The expected payout is E[X] = 0(1/2) + 4(1/3) + 10(1/6) = 3.
Sample page 5
QUANT FINANCE PLAYBOOK PROBABILITY & TRADING Edition 01 / September 2026 05 Expected profit is therefore zero. The probability of a strictly positive profit is 1/3 + 1/6 = 1/2. The probability of losing 3 units is also 1/2. None of these statements says the ticket is safe. They describe different aspects of its distribution. Now offer the same ticket for 2.5 units. Expected profit becomes 0.5 units, while the probability of positive profit remains 1/2. The price change has improved the amount you make on every outcome. It has not moved any outcome across zero except in cases where the price crosses a payout level. This is why a win rate does not contain all the information needed to compare decisions. An adequate spoken answer would name the payoff distribution, calculate the mean, then qualify the decision: “Under expected-profit maximization with these probabilities and no other constraints, a price below 3 has positive expected profit. That does not remove the chance of a loss.” Equal outcomes are a modeling choice Imagine two containers. Container A has one red and one blue token. Container B has nine red and one blue token. If you choose a container fairly and then choose a token uniformly inside it, red has probability (1/2)(1/2) + (1/2)(9/10) = 7/10. If instead you pool all twelve tokens and choose one uniformly, red has probability 10/12 = 5/6. Both experiments use fair random choices. Their answers differ because the first experiment gives each token in A probability 1/4 and each token in B probability 1/20. Pooling assigns every token probability 1/12. The error to notice is not arithmetic. It is an unstated change from equal containers to equal tokens. A useful diagram has two levels: the container selected, then the token selected within it. Put a probability on each edge. Multiplying down a branch gives the probability of a complete outcome. Adding disjoint branches gives the probability of their union. Sanity checks that are worth the time A probability must lie between zero and one. Probabilities of exhaustive, disjoint outcomes sum to one. An expected value of a bounded variable lies within its bounds. A quantity called “expected number of attempts” cannot be negative. If all payoffs double, expected payout doubles; if a cost increases by one, profit decreases by one on every outcome. These checks do not establish correctness, but they expose many wrong answers cheaply. An expected ticket payout of 14 is impossible when the maximum payout is 10. A conditional probability of 0.9 may be entirely plausible even if its prior was 0.1, so a “large change” by itself is not an error. Ask what evidence produced that change. Exercise 1.1 - The inspection fee A component inspection returns “pass” with probability 0.7. You receive 12 units after a pass and 2 after a fail. Entering the inspection costs 5 units regardless of the outcome. Find expected profit, the probability of positive profit, and the worst possible profit.
Sample page 6
QUANT FINANCE PLAYBOOK PROBABILITY & TRADING Edition 01 / September 2026 06 Solution. The two profits are 7 and -3. Expected profit is 0.7(7) + 0.3(-3) = 4. The probability of positive profit is 0.7. Worst profit is -3. Calculating the mean payout, 9, is an intermediate step; it is not expected profit. The fee is paid on both branches, so it must not be multiplied only by the probability of passing. Follow-up. The entry fee rises to 8. Expected profit becomes 1, the probability of a positive profit remains 0.7, and the worst profit becomes -6. At a fee of 12, the pass outcome is zero rather than positive. Be precise about whether “profit” means strictly greater than zero. Exercise 1.2 - Two selection procedures Shelf A holds two short manuals and one long manual. Shelf B holds one short manual and five long manuals. Procedure I selects a shelf with equal probability and then a manual uniformly from that shelf. Procedure II selects one of all nine manuals uniformly. Calculate the probability of selecting a short manual under each procedure. Solution. Procedure I gives 0.5(2/3) + 0.5(1/6) = 5/12. Procedure II gives 3/9 = 1/3. The manuals are not equally likely under Procedure I: an A manual has probability 1/6, while a B manual has probability 1/12. Listing those individual probabilities is an independent way to confirm the calculation. What to explain aloud. “I’m weighting shelves equally in the first procedure and manuals equally in the second. The small shelf contains a larger fraction of short manuals, so equal shelf weighting raises the probability.” That explanation checks the direction before relying on the decimal. Exercise 1.3 - Profit versus payout A game pays 20 units with probability 0.1 and pays 1 otherwise. A player says that a price of 2 units is unattractive because there is only a 10% chance of making money. Compute expected profit at that price. Does the player's win-rate observation settle whether the game is attractive? Solution. Expected payout is 0.1(20) + 0.9(1) = 2.9. Expected profit is 0.9. The player is correct about the probability of positive profit: only the 20-unit outcome beats the price. But expected profit is positive because that less frequent outcome has a large payoff. Whether to accept depends on the decision objective and constraints. Repeated plays do not make a finite player's losses impossible, and independence between plays would need to be stated separately. Exercise 1.4 - Information arriving too late A ticket pays 8 units after a high state and 0 after a low state. Each state has probability 1/2. The ticket costs 5. You may either buy before the state is revealed, or wait, observe the state perfectly, and then buy at the same price. Find the best expected profit under each timing rule, assuming you may decline and want to maximize expected profit. Solution. Before observing the state, buying gives expected profit 4 - 5 = -1. Declining gives zero, so decline. After observing, buy in the high state for profit 3 and decline in the low state. Expected profit is 0.5(3) + 0.5(0) = 1.5. The option to decide after observing is worth 1.5 units relative to the best uninformed action in this particular setup. The payoff distribution has not changed; the feasible decision rule has.
Sample page 7
QUANT FINANCE PLAYBOOK PROBABILITY & TRADING Edition 01 / September 2026 07 Common wrong turn. Comparing 1.5 with -1 and calling the difference the value of information ignores that an uninformed player can decline. Compare optimal decisions under each information set. A model note you can reuse Before a practice calculation, write these five labels in the margin: experiment, information, target, units, assumptions. After the calculation, add one bound or limiting-case check. If your answer changes during discussion, record which line changed. That makes the correction explainable and gives you something specific to practice next time.
Sample page 8
QUANT FINANCE PLAYBOOK PROBABILITY & TRADING Edition 01 / September 2026 08 CHAPTER 02 2. Conditioning changes the room Suppose you watch a detector flag an event. “The detector is 90% accurate” is not enough information to find the chance that the event occurred. You need to know what accuracy means, how often the event occurs, and how the detector behaves when it does not occur. Conditioning is an exercise in changing the population you are counting. You begin with all possible cases. Then you keep only the cases consistent with the evidence. Within that smaller population, you recalculate the proportions. For events A and B with P(B) greater than zero, P(A | B) = P(A and B) / P(B). The denominator matters as much as the numerator. It describes everyone who could have produced the observation, including cases that do not match the explanation you initially favored. An original signal example In a synthetic dataset, 20% of observations belong to state H and 80% belong to state L. A detector emits a positive signal on 75% of H observations and 10% of L observations. These are stipulated probabilities for an educational problem, not measured performance of a market signal. Imagine 1,000 observations with exactly those proportions. There are 200 H cases, of which 150 are positive. There are 800 L cases, of which 80 are positive. Among the 230 positive signals, 150 came from H. Therefore P(H | positive) = 150/230 = 15/23, approximately 65.2%. The same calculation in probability form is 0.20 × 0.75 / (0.20 × 0.75 + 0.80 × 0.10). Do not replace this with 75%. That is P(positive | H), the fraction of H cases caught by the detector. We were asked about P(H | positive), the composition of the positive group. The frequency table is useful even when numbers are not integral. It is a way to organize proportions, not a claim that the next 1,000 observations will exactly match their expectations. State Positive Negative Total H 150 50 200 L 80 720 800 Total 230 770 1,000
Sample page 9
QUANT FINANCE PLAYBOOK PROBABILITY & TRADING Edition 01 / September 2026 09 Base rates can dominate the headline rate Keep the detector's conditional behavior fixed but make H only 1% of observations. In 10,000 proportionally allocated cases, the H group supplies 75 positive signals and the L group supplies 990. The chance of H after a positive signal is now 75/1,065 = 5/71, approximately 7.0%. Nothing about the detector's conditional rates became worse. The population changed. Rare events can produce a small share of observed positives even when the detector catches most true events. If someone quotes a precision, posterior probability or predictive value, ask which population that number describes. This also explains why a result observed in a carefully selected dataset need not transfer to a different setting. Selection can change the proportions before the detector is even applied. The mathematics tells you what happens under specified rates. It does not prove those rates remain stable elsewhere. Two observations require a joint model Return to the first detector with a 20% H rate. Suppose it produces two positive signals. You cannot simply square probabilities unless you know how the two observations relate. If the two signals are conditionally independent given the state, the likelihood of two positives is 0.75² under H and 0.10² under L. The posterior becomes 0.20 × 0.75² / (0.20 × 0.75² + 0.80 × 0.10²) = 225/241, approximately 93.4%. If the second “signal” is just a copy of the first, it provides no new information. The posterior stays 15/23. Two entries in a spreadsheet are not necessarily two independent observations. There is a further subtlety: conditional independence does not generally imply unconditional independence. If both detectors respond to the same hidden state, their outputs can be related in the population even when their remaining errors are independent within each state. State the level at which your independence assumption applies. Sampling and disclosure are part of the evidence You draw two cards, each independently marked red or blue with equal probability. Someone tells you, “At least one is red.” The equally likely ordered outcomes RR, RB, BR and BB are reduced to RR, RB and BR. The chance both are red is 1/3. Now use a different observation rule: choose one of the two positions fairly, inspect it, and report that the inspected card is red. Conditional on that report, the uninspected card remains independently red with probability 1/2. The report sounds similar, but the mechanism weights the original outcomes differently. RR always generates a red report; RB and BR do so only half the time. Interview questions involving a person who “reveals” information can hide this distinction. Ask what rule generated the statement. When no rule is provided, state your interpretation and demonstrate why alternatives matter rather than pretending there is one inevitable answer.
Sample page 10
QUANT FINANCE PLAYBOOK PROBABILITY & TRADING Edition 01 / September 2026 10 Exercise 2.1 - A rare component defect A batch contains 4% defective components. A scanner flags 90% of defective components and 5% of nondefective components. Given a flag, what is the probability the component is defective? Solution. In a proportionally allocated 10,000 cases, there are 400 defective components and 360 defective flags. The 9,600 nondefective components contribute 480 flags. The requested probability is 360/(360 + 480) = 3/7, approximately 42.9%. A flag substantially increases the probability from 4%, but does not make a defect more likely than not. The false-positive contribution exceeds the true-positive contribution because the nondefective group is much larger. Follow-up. What happens if the defective share doubles to 8%, keeping conditional scanner rates fixed? The posterior becomes 0.072/(0.072 + 0.046) = 36/59, approximately 61.0%. State that this follow-up assumes the scanner's conditional behavior is unchanged. Exercise 2.2 - A negative signal Use the synthetic H/L detector from the chapter: P(H) = 0.2, P(positive | H) = 0.75 and P(positive | L) = 0.1. Find P(H | negative). Solution. The negative H mass is 0.2(0.25) = 0.05. The negative L mass is 0.8(0.9) = 0.72. Therefore P(H | negative) = 0.05/0.77 = 5/77, approximately 6.5%. This also follows directly from the negative column of the table. A negative lowers the H probability, as expected, but does not reduce it to zero because the detector misses some H cases. Check. Weight the two posterior probabilities by the chance of their respective signal: (0.23)(15/23) + (0.77)(5/77) = 0.15 + 0.05 = 0.20. Averaging over all possible observations recovers the prior. Exercise 2.3 - Two conditionally independent tests A hidden state A has prior probability 1/3. A binary test is positive with probability 0.8 in A and 0.2 outside A. Two tests are conditionally independent given the state. Find the probability of A after two positive tests. What changes if the second result is an exact duplicate of the first? Solution. Under conditional independence, the A contribution is (1/3)(0.64) and the non-A contribution is (2/3)(0.04). Their ratio gives 0.64/(0.64 + 0.08) = 8/9. With an exact duplicate, there is only one observation, giving 0.8/(0.8 + 0.4) = 2/3. You must not use the independence calculation for two outputs that share all their information. Spoken explanation. “Each positive multiplies the odds of A by 0.8/0.2 = 4, provided the tests are conditionally independent. Prior odds of 1:2 therefore become 16:2, or 8:1, after two positives.” A shorter explanation is fine if it identifies the conditional assumption correctly. Convert odds of 8:1 to a probability using 8/(8 + 1), not 8/1.
Sample page 11
QUANT FINANCE PLAYBOOK PROBABILITY & TRADING Edition 01 / September 2026 11 Exercise 2.4 - The selected analyst A team has six analysts. Two specialize in derivatives and four specialize in other areas. Each derivatives specialist independently volunteers for a workshop with probability 0.8, and each other analyst independently volunteers with probability 0.4. Procedure I first selects one analyst uniformly and asks whether that analyst volunteered. Given a yes, what is the probability the selected analyst is a derivatives specialist? Do these facts alone justify the same answer for Procedure II, which first observes the whole volunteer pool and chooses uniformly from that pool if it is nonempty? Solution to Procedure I. The prior specialist share is 1/3. The relevant likelihoods are 0.8 and 0.4, so the posterior is (1/3)(0.8) / [(1/3)(0.8) + (2/3)(0.4)] = 1/2. Procedure II. The method weights realized volunteer pools equally according to their probability and then divides by the pool's realized size. Its specialist probability is E[S/(S + O) | S + O > 0], where S and O are the counts of volunteering specialists and others. It is not generally equal to E[S]/E[S + O]. The supplied independent Bernoulli model is enough to compute it by enumerating S = 0, 1, 2 and O = 0, 1, 2, 3, 4, omitting the empty pool and normalizing by its complement. The two-stage sampling rule changes the answer; do not substitute a ratio of expected counts for the expected ratio. For a full calculation, the specialist-count probabilities are 0.04, 0.32, 0.64, and the other-count probabilities are 0.1296, 0.3456, 0.3456, 0.1536, 0.0256. Sum P(S=s)P(O=o) × s/(s+o) over nonempty pools. The numerator is 0.5333333333, and the nonempty-pool probability is 1 - (0.04)(0.1296) = 0.994816. The answer is approximately 0.536113. Conditional on being able to select someone, Procedure II gives about a 53.6% specialist probability. The modest numerical difference is less important than recognizing the different experiment. What to put in an error log If a conditioning problem goes wrong, classify it before trying another. Did you reverse P(A | B)? Omit a competing explanation from the denominator? Treat correlated reports as independent evidence? Ignore the rule that selected or disclosed the observation? Each diagnosis suggests a different repair. Repeating a Bayes formula from memory will not fix a sampling-mechanism error.